


Geography is closely related to human life, and the application of geography technology can bring a new perspective for human to see the world.
When we begin to think of television as data and geography as a lens through which to explore it, we are able to “see” the news in an entirely new light. Most importantly, we able to quantify just how little of the world we actually hear about each day and the importance of editorial decisions and agenda setting in our understanding of the world around us.
Kalev Leetaru worked with the Internet Archive’s incredible Television News Archive to explore how powerful computer algorithms could allow us to “see” the news in entirely new ways. Geography offers a particularly powerful and yet underutilized lens through which to understand the news. In fact, it was an animated map of 400,000 hours of television that was the very first major visualization.Kalev leetaru combines the powerful data mining algorithm with the analysis ability of bigquery and the visualization ability of Carto and other platforms from TV news archives, and applies it to archives as incredible and unique as TV news archives of Internet archives. Therefore, we now have the tools to explore our world in ways we could never before dream of and to see the world around us in a whole new light.
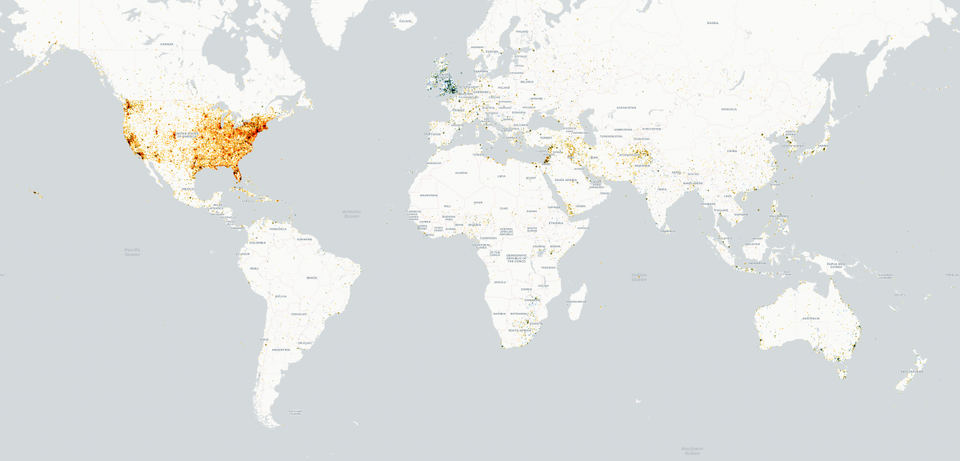
It is hoped that this research can further follow up the aggregation and animation at the urban and national levels, and explore more different dimensions of TV geography. Figure 1. Geography of BBC News 2017-2018 (blue) versus CNN, Fox News and MSNBC combined coverage 2009-2018 (yellow/orange)
Source from: |

This site is licensed under a Creative Commons Attribution 4.0 International License.